Reports
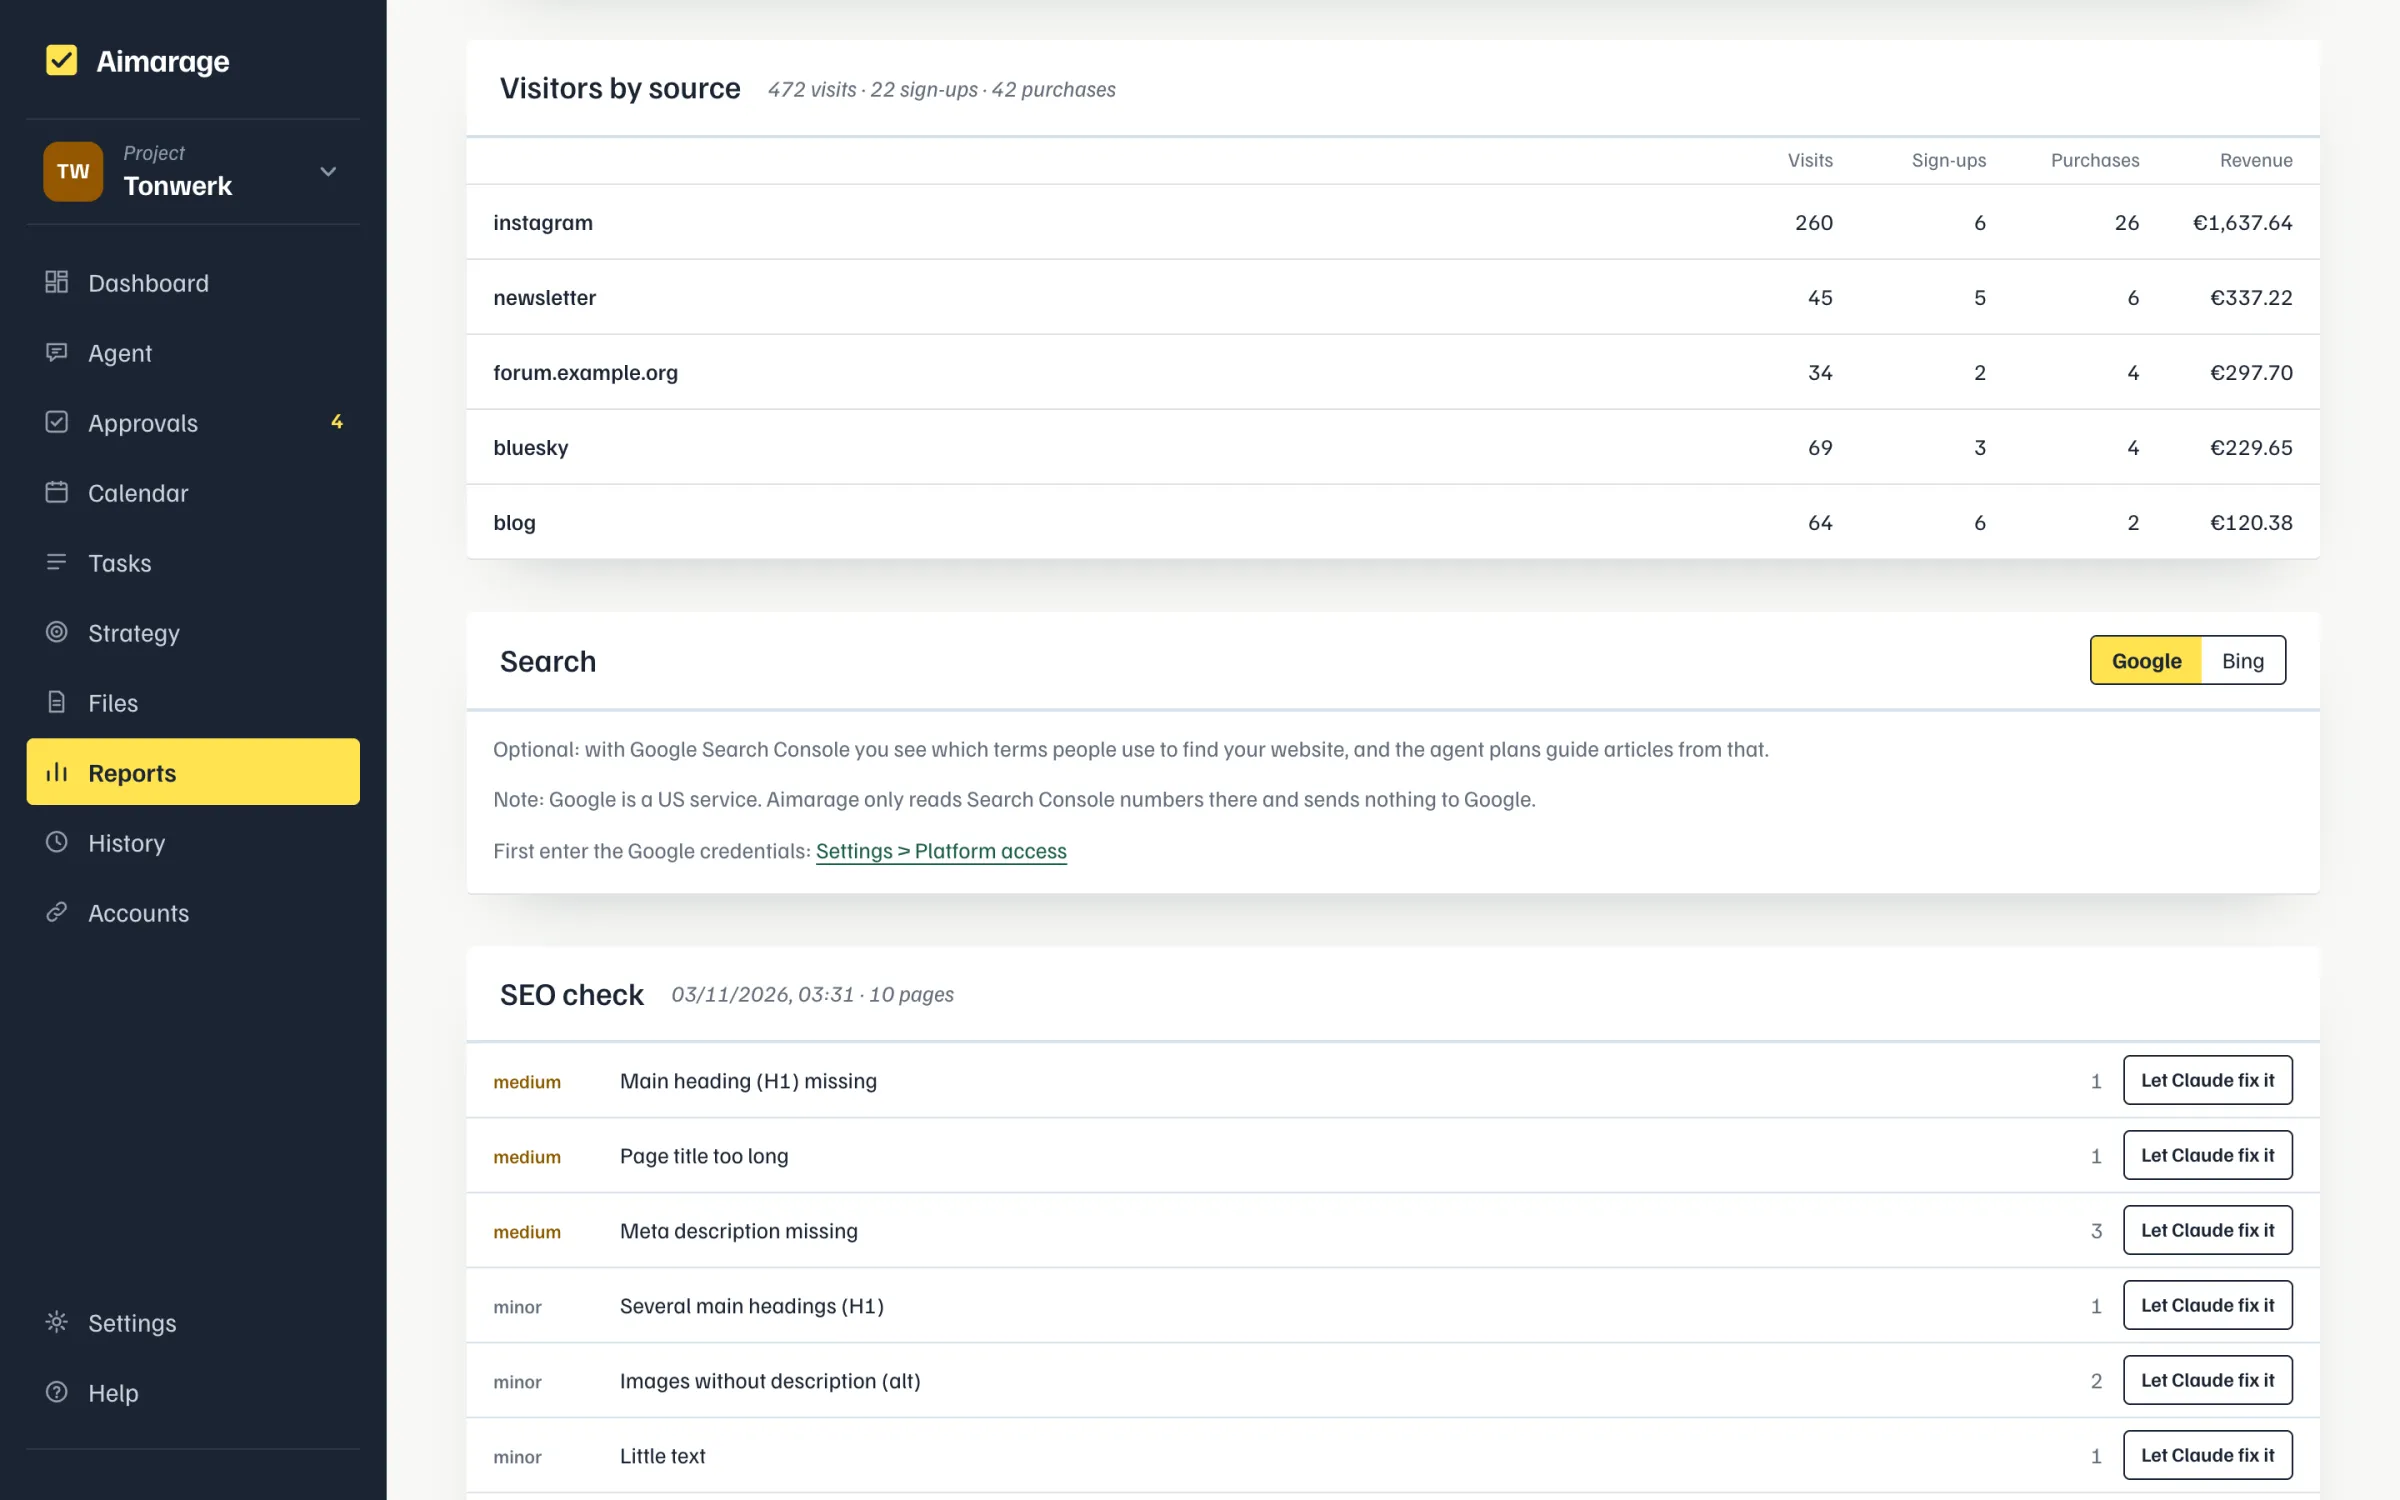
Reports shows, for the chosen period (top right: 7, 30 or 90 days, 6 or 12 months, This year or "Custom range" with From and To, at most 2 years), numbers, visitors per source (UTM), search (Google & Bing), SEO check, AI visibility, best times, results per channel, goals and the weekly reports (every Friday). At the top each metric has a tile with the total for the period and the change against the previous period of the same length; clicking tiles turns their lines in the chart below on and off, up to 3 at once, each in its own color (stroke on the tile); hover shows the day and all values. If the numbers are far apart (e.g. visitors and signups), each line is scaled to its own peak (100 %). Visitors, signups, purchases and followers come in automatically once stats, Google/Bing or social accounts are connected. Other numbers you add below the chart with "Add a number by hand" (the link is hidden when every metric comes in automatically) or tell the agent. "Als PDF" exports a project's report.